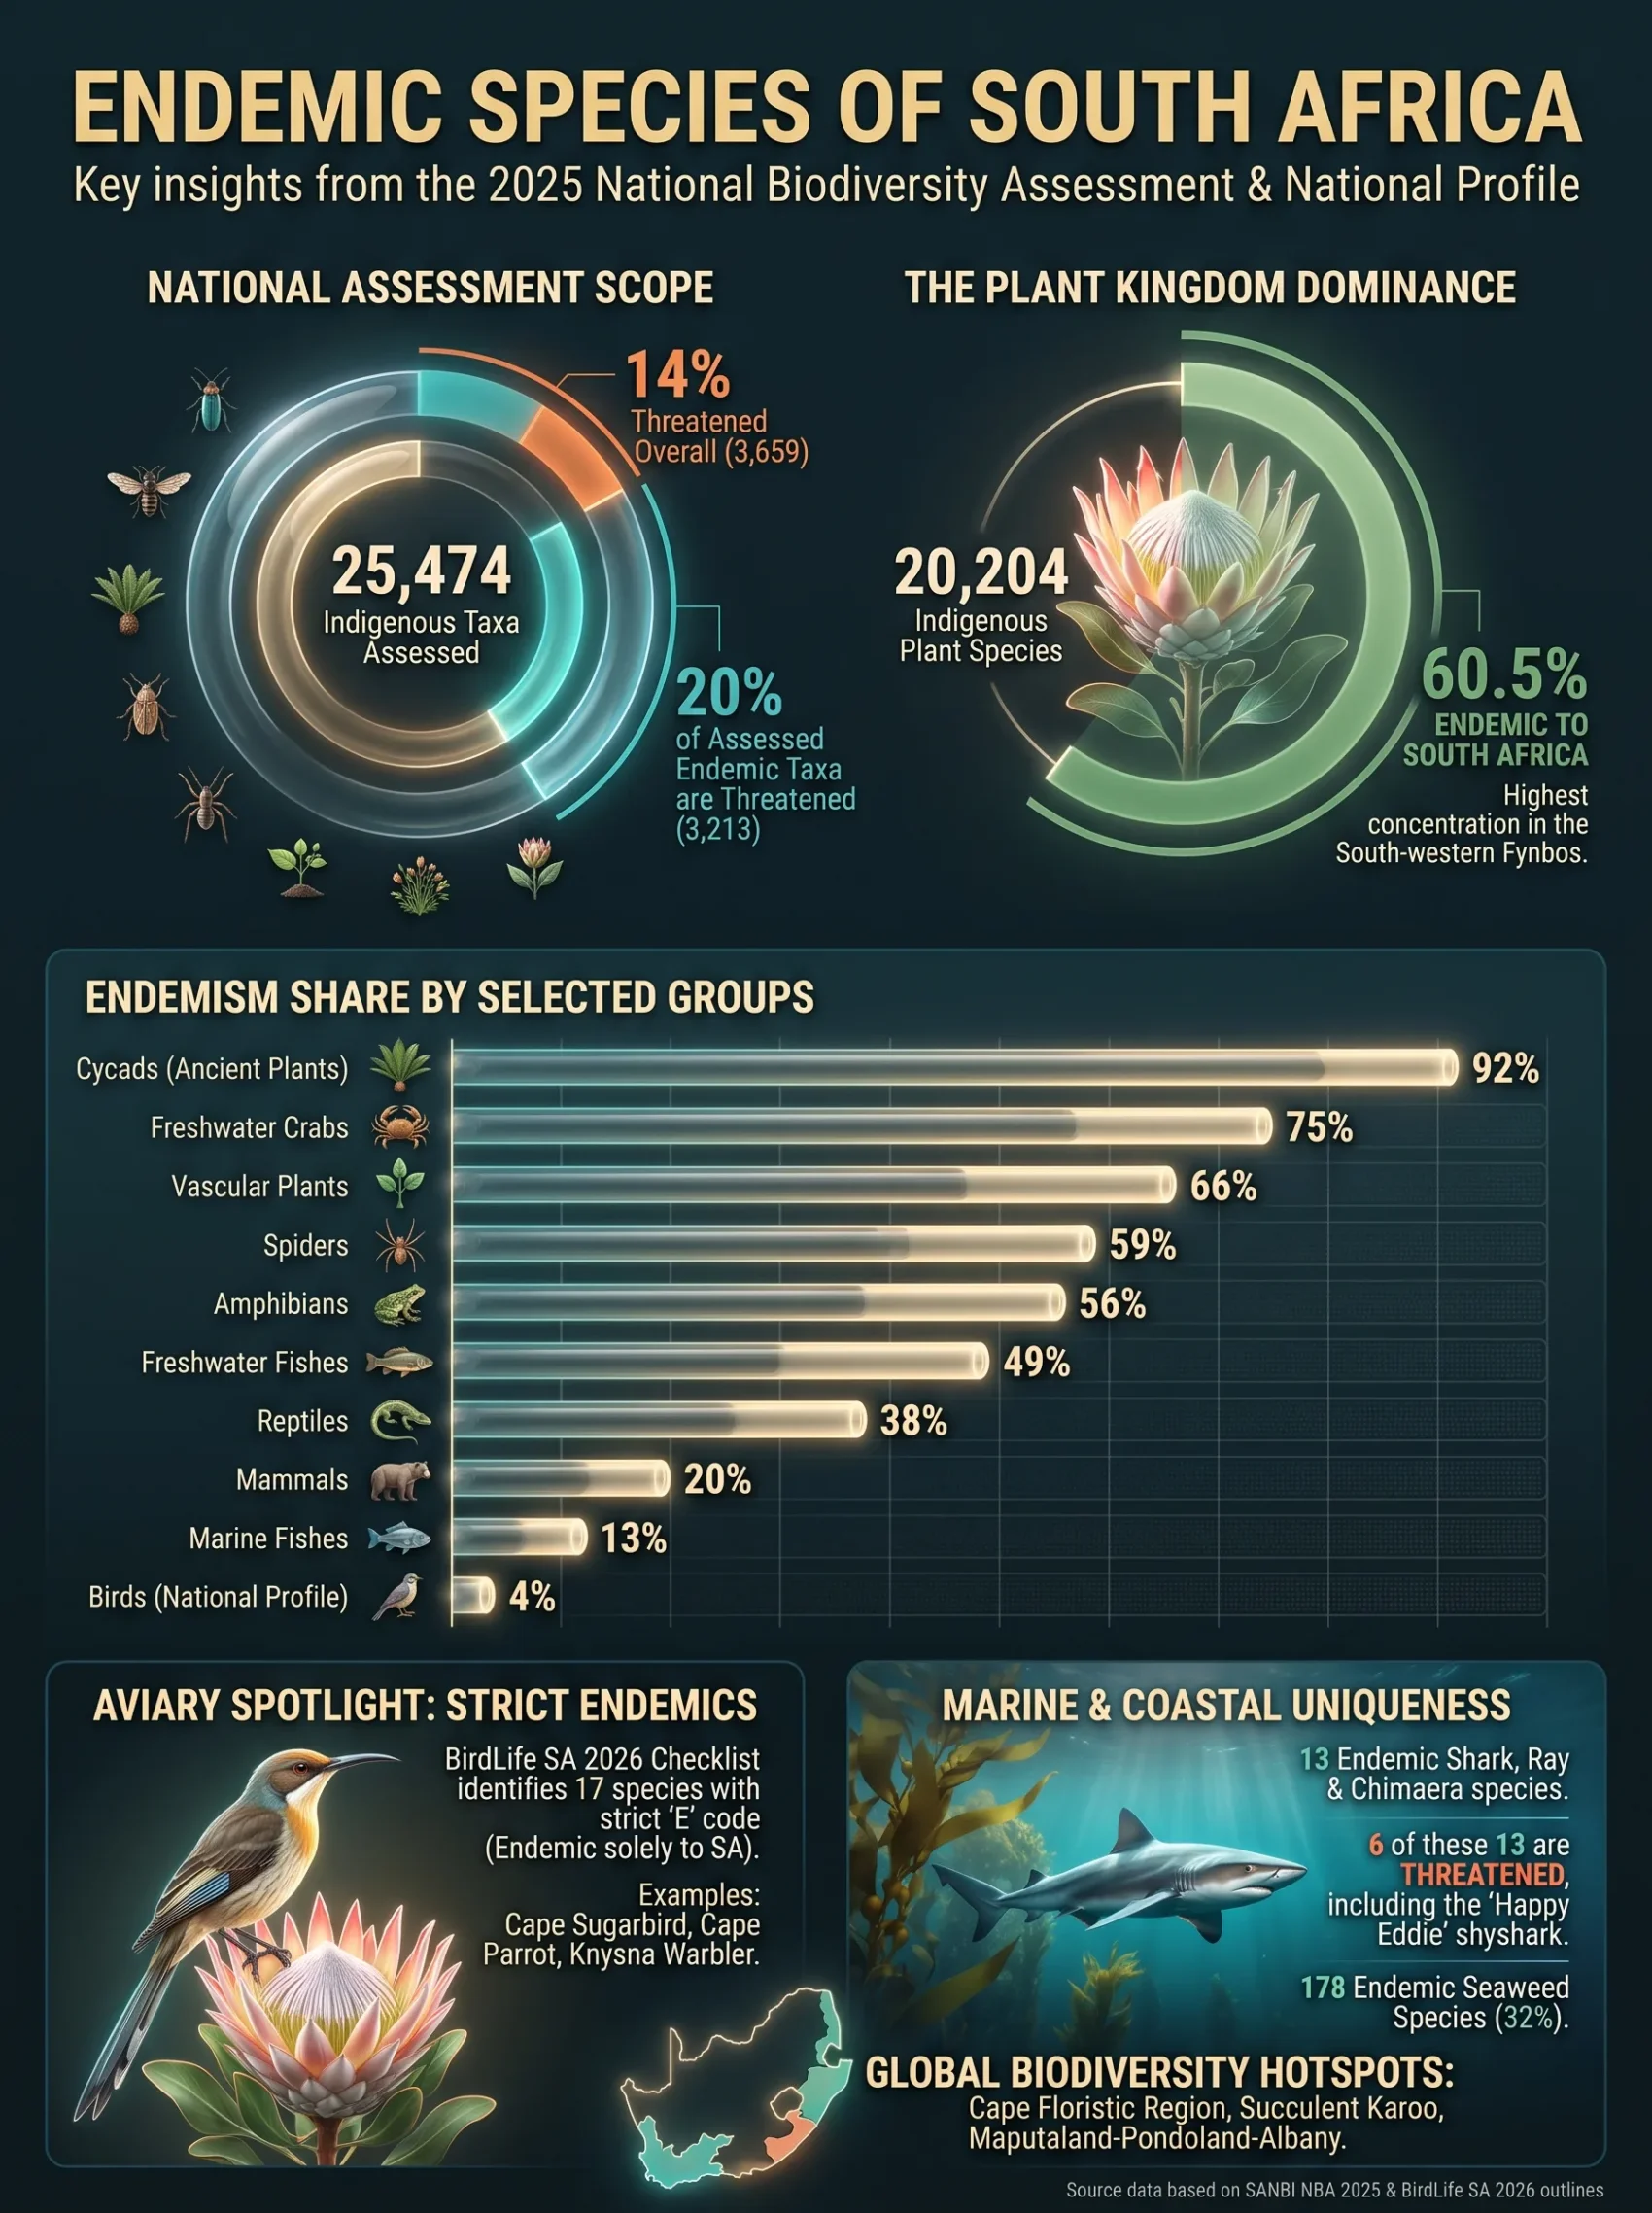
South Africa’s 2025 National Biodiversity Assessment reports endemism through separate taxonomic datasets rather than a single synthetic all-taxa species total. Its national threat-status analysis covers 25,474 indigenous taxa across 15 assessed groups; 3,659 are threatened, and 3,213 endemic taxa in those assessed groups are threatened. [S1]
| Measure | Value |
|---|---|
| Indigenous taxa assessed for extinction risk | 25,474 taxa [S1] |
| Threatened assessed taxa | 3,659 taxa (14%) [S1] |
| Extinct or possibly extinct assessed taxa | 122 taxa (0.5%) [S1] |
| Threatened endemic taxa in assessed groups | 3,213 taxa (20%) [S1] |
| Extinct or possibly extinct endemic taxa in assessed groups | 120 taxa (0.8%) [S1] |
| Estimated animal species | about 67,000 species [S2] |
| National Plant Checklist taxa | 23,514 taxa [S2] |
| National Plant Checklist species | 21,539 species [S2] |
| Indigenous plant species in the national checklist | 20,204 species [S2] |
| Indigenous plant species endemic to South Africa | 60.5% [S2] |
| Endemic cycad species | 35 of 38 species (92%) [S2] |
| Endemic vascular plant species | 13,965 of 21,279 species (66%) [S2] |
| Endemic spider species | 1,302 of 2,214 species (59%) [S2] |
| Endemic amphibian species | 75 of 135 species (56%) [S2] |
| Endemic bee species | 646 of 1,253 species (52%) [S2] |
| Endemic butterfly species | 419 of 799 species (52%) [S2] |
| Endemic freshwater fish species | 58 of 118 species (49%) [S2] |
| Endemic reptile species | 155 of 407 species (38%) [S2] |
| Endemic dung beetle species | 221 of 600 species (37%) [S2] |
| Endemic seaweed species | 178 of 564 species (32%) [S2] |
| Endemic mammal species | 67 of 339 species (20%) [S2] |
| Endemic dragonfly and damselfly species | 30 of 164 species (18%) [S2] |
| Endemic non-vascular plant species | 156 of 872 species (18%) [S2] |
| Endemic nudibranch species | 120 of 700 species (17%) [S2] |
| Endemic marine fish species | 261 of 2,072 species (13%) [S2] |
| Endemic shark, ray and chimaera species | 13 of 191 species [S2] |
| Endemic bird species in the 2025 national profile | 26 of 728 species (4%) [S2] |
| Endemic freshwater-crab taxa in the threat assessment | 18 of 24 taxa (75%) [S1] |
| Endemic Anostraca taxa in the threat assessment | 16 of 36 taxa (44%) [S1] |
| Endemic seabream taxa in the threat assessment | 15 of 42 taxa (36%) [S1] |
{
  "type": "bar",
  "title": "Endemic share of selected South African taxonomic groups",
  "description": "Published species-level endemism percentages from the 2025 national biodiversity profile.",
  "unit": "percent",
  "orientation": "horizontal",
  "data": [
    {"label": "Cycads", "value": 92},
    {"label": "Vascular plants", "value": 66},
    {"label": "Spiders", "value": 59},
    {"label": "Amphibians", "value": 56},
    {"label": "Bees", "value": 52},
    {"label": "Butterflies", "value": 52},
    {"label": "Freshwater fishes", "value": 49},
    {"label": "Reptiles", "value": 38},
    {"label": "Dung beetles", "value": 37},
    {"label": "Seaweed", "value": 32},
    {"label": "Mammals", "value": 20},
    {"label": "Dragonflies & damselflies", "value": 18},
    {"label": "Non-vascular plants", "value": 18},
    {"label": "Nudibranchs", "value": 17},
    {"label": "Marine fishes", "value": 13},
    {"label": "Birds", "value": 4}
  ],
  "source": "SANBI 2025 biodiversity profile [S2]"
}
Species, taxa and checklist boundaries
The national sources use more than one biological unit. The biodiversity-profile figures above are species-level richness and endemism estimates for selected groups, while the national threat-status analysis works with assessed taxa. A taxon count can include a treatment that is not interchangeable with a species count, so the two datasets should not be added together. [S1] [S2]
Plants show why this distinction matters. The biodiversity profile lists 13,965 endemic vascular-plant species among 21,279 South African vascular-plant species, while the plant Red List page works with an indigenous flora of 20,248 taxa and warns that Checklist and Red List totals can differ as checklists are updated and synonym treatments are reconciled. The same plant page states that the 2025 National Plant Checklist contains 20,204 indigenous species and that 60.5% are endemic. [S3]
Country scope. South Africa’s national biodiversity profile includes the mainland, surrounding national marine space and the subantarctic Prince Edward Islands. [S2] Introduced, cultivated, naturalized or translocated occurrences do not expand a species’ natural native range for country-endemism purposes.
Strict South Africa-endemic birds in the 2026 checklist
BirdLife South Africa’s 2026 official country checklist separates E (endemic to South Africa) from SLE (endemic to South Africa, Lesotho and Eswatini), NE (near endemic), BNE and SLE NE. Counting only entries carrying the strict E code gives 17 species. The table below contains every E-coded species in that checklist. [S4]
| Common name | Scientific name |
|---|---|
| Cape Bulbul | Pycnonotus capensis |
| Protea Canary (Seedeater) | Crithagra leucoptera |
| Fynbos Buttonquail | Turnix hottentottus |
| Cape Long-billed Lark | Certhilauda curvirostris |
| Red Lark | Calendulauda burra |
| Rudd’s Lark | Heteromirafra ruddi |
| Southern Black Korhaan | Afrotis afra |
| Agulhas Long-billed Lark | Certhilauda brevirostris |
| Botha’s Lark | Spizocorys fringillaris |
| Cape Parrot | Poicephalus robustus |
| Cape Rockjumper | Chaetops frenatus |
| Cape Siskin | Crithagra totta |
| Orange-breasted Sunbird | Anthobaphes violacea |
| Cape Sugarbird | Promerops cafer |
| Knysna Warbler | Bradypterus sylvaticus |
| Victorin’s Warbler | Cryptillas victorini |
| Knysna Woodpecker | Campethera notata |
Species marked SLE or NE are intentionally excluded from this strict country-endemic subset. For example, the 2026 checklist codes Yellow-breasted Pipit (Hemimacronyx chloris) as SLE rather than E. [S4]
Bird count boundary. SANBI’s 2025 biodiversity profile reports 26 endemic bird species, while the 2026 BirdLife checklist contains 17 entries marked with the strict E code. These figures come from different data products and should remain separate unless their taxonomy and endemism definitions are reconciled. [S2] [S4]
Plant endemism and taxonomic scale
Plants account for the largest absolute endemic counts in the national profile. The 2025 biodiversity profile gives 13,965 endemic vascular-plant species and 156 endemic non-vascular plant species, while cycads have the highest published endemic share among the profile groups at 35 of 38 species. [S2]
SANBI’s plant assessment also identifies the south-western Fynbos as the strongest national concentration of plant endemism, with moderate concentrations in arid regions, low-escarpment bushveld and coastal grasslands. It reports that one in five endemic plant taxa in the assessed plant dataset is at risk of extinction. [S3]
Freshwater and marine endemism
The freshwater component contains several groups with high country endemism. In the NBA 2025 threat-status dataset, 18 of 24 freshwater-crab taxa are endemic, as are 16 of 36 Anostraca taxa. The national species profile separately reports 58 endemic freshwater-fish species out of 118. [S1] [S2]
Marine endemism is distributed unevenly among groups. The national profile lists 261 endemic marine-fish species, 120 endemic nudibranch species, 178 endemic seaweed species and 13 endemic sharks, rays and chimaeras. The dedicated NBA shark assessment records 13 endemic cartilaginous-fish species, of which six are threatened; it names the happy Eddie (Haploblepharus edwardsii) among the country-restricted sharks. [S5]
Shark percentage. The national biodiversity profile publishes a 6% endemic share for sharks, rays and chimaeras, while its count table gives 13 endemic species out of 191. The dedicated 2025 shark assessment reports the same 13-of-191 count as 7% after rounding. The national table above therefore keeps the count without attaching either percentage. [S2] [S5]
Threatened endemic sharks, rays and chimaeras
The 2025 shark assessment identifies all six threatened species within the 13-species South Africa-endemic cartilaginous-fish set. [S5]
| Common name | Scientific name | Threat category |
|---|---|---|
| Tiger catshark | Halaelurus natalensis | Vulnerable |
| Happy Eddie | Haploblepharus edwardsii | Endangered |
| Brown shyshark | Haploblepharus fuscus | Vulnerable |
| Natal shyshark | Haploblepharus kistnasamyi | Vulnerable |
| Twineye skate | Raja ocellifera | Endangered |
| Flapnose houndshark | Scylliogaleus quecketti | Vulnerable |
Geographic concentration of endemism
South Africa contains three terrestrial global biodiversity hotspots: the Cape Floristic Region, the Succulent Karoo and the Maputaland-Pondoland-Albany region. The national profile also records 463 terrestrial ecosystem types, about 80% of which are endemic at ecosystem level. [S2]
| Geographic unit | Endemism signal |
|---|---|
| South-western Fynbos | Highest national concentration of plant endemism reported by SANBI. [S3] |
| Arid western regions | Moderate national concentration of plant endemism; includes much of the Succulent Karoo. [S3] |
| Low-escarpment bushveld | Moderate national concentration of plant endemism. [S3] |
| Coastal grasslands | Moderate national concentration of plant endemism. [S3] |
Hotspot membership is not equivalent to strict South Africa endemism. A species can occur mainly inside a named hotspot and still extend naturally into a neighbouring country. Country-endemic status depends on the species’ natural native range, not on the hotspot label.
Species-list coverage across taxon systems
South Africa’s national biodiversity infrastructure distributes species identities across taxon-specific systems rather than one reconciled all-taxa endemic-species checklist. SANBI’s official species-status portal points users to separate current assessment sources for mammals, birds, amphibians, reptiles, fairy shrimps, freshwater crabs and spiders. [S6]
That structure matters for a country with thousands of endemic plant and invertebrate species. A short mixed-taxon list would create a false impression of national coverage. The bird table above is a defined exhaustive subset under BirdLife South Africa’s 2026 strict E code; the broader national profile is therefore kept at the source-defined species or taxon level instead of being converted into an artificial cross-taxon total.
Sources
[S1] ↩ South African National Biodiversity Institute — Species threat status and protection level, National Biodiversity Assessment 2025. National assessed-taxon totals, endemic shares and extinction-risk statistics.
[S2] ↩ South African National Biodiversity Institute — South Africa biodiversity profile factsheet. 2025 national species-richness and endemic-species estimates for selected taxonomic groups.
[S3] ↩ South African National Biodiversity Institute — Plants, National Biodiversity Assessment 2025. Plant checklist scope, taxonomic-number caveats and spatial concentration of plant endemism.
[S4] ↩ BirdLife South Africa — Checklist of Birds in South Africa 2026. Official 2026 bird taxonomy and E, SLE, NE, BNE and SLE NE endemism codes.
[S5] ↩ South African National Biodiversity Institute — Sharks, rays and chimaeras, National Biodiversity Assessment 2025. Endemic cartilaginous-fish count and threat-status breakdown.
[S6] ↩ South African National Biodiversity Institute — Red List of South African Species. Official portal routing current animal assessments to taxon-specific sources.